
Last updated: October 2020
Contents
It will be disheartening to wake one morning and realize that your production-grade system is down or crashed due to the high consumption or erratic consumption of system resources. CPU & memory resources especially.
Hence, why it is important & necessary to be proactive than reactive, and to be proactive, you need to regularly monitor your system.
There are a lot of system monitoring tools in Linux out there, including open source and non-open source tools. Even many times, a well-written bash script can be effective in monitoring system activities. Activities such as network, process, log, and system activities in general.
Network activities will be monitored and managed effectively by using a network monitoring tool while the same applies to log and process activities. Process activities will be monitored and managed effectively by using a process monitoring tool.
In this tutorial, we learn the different types of process monitoring tools in Linux and how to use them.
The top tool is a very common tool that is used to manage and monitor processes in Linux. It is one of the best monitoring tools in Linux.
To use/launch top, use the command “top”
[root@DRDEV1 ~]# toptop - 18:24:57 up 5:29, 5 users, load average: 0.00, 0.00, 0.00
Tasks: 331 total, 3 running, 327 sleeping, 1 stopped, 0 zombie
%Cpu(s): 0.7 us, 1.0 sy, 0.0 ni, 98.3 id, 0.0 wa, 0.0 hi, 0.0 si, 0.0 st
MiB Mem : 1806.2 total, 254.7 free, 1238.1 used, 313.4 buff/cache
MiB Swap: 1536.0 total, 1432.7 free, 103.2 used. 405.8 avail Mem
PID USER PR NI VIRT RES SHR S %CPU %MEM TIME+ COMMAND
1228 root 20 0 424332 24400 12192 S 0.3 1.3 0:04.43 tuned
6581 root 20 0 64008 4760 3896 S 0.3 0.3 0:36.11 top
6590 root 20 0 64008 4804 3936 S 0.3 0.3 0:36.12 top
1 root 20 0 179332 10888 7140 S 0.0 0.6 0:07.41 systemd
2 root 20 0 0 0 0 S 0.0 0.0 0:00.02 kthreadd
3 root 0 -20 0 0 0 I 0.0 0.0 0:00.00 rcu_gp
4 root 0 -20 0 0 0 I 0.0 0.0 0:00.00 rcu_par_gp
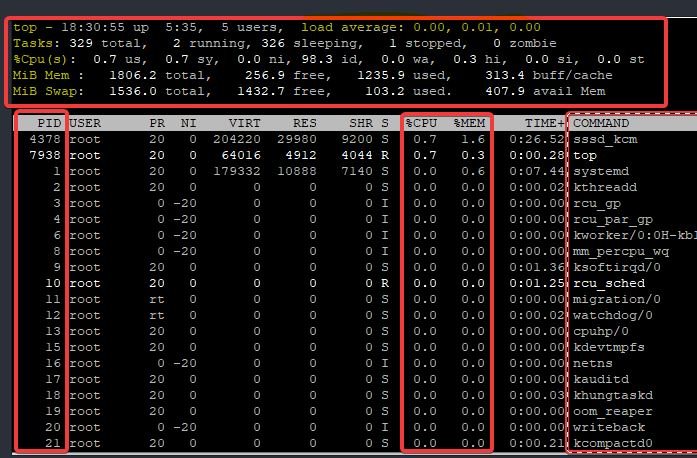
The output of the top command will display a lot of information that can be useful to the administrator. And by default, the output is displayed in descending order.
Let’s understand this information.
. The “top” column (first line): shows the system time which is 18:30:55 sec, the uptime which is 5:35 (5 hrs, 35 min), the number of users currently logged on which are 5 users, and the load average over the period of 1 minute, 5 minutes, and 15 minutes.
A rough estimation of getting the load average is by dividing the load average by the number of the system’s CPU.
For example, if the no of CPU on my system is 1, from the screenshot above, the load average over the period of 5 min will be (0.01/1=0.01*100=1%). Apparently, the system was overloaded by 1% over the period of 5 minutes.
The Linux Journal talks extensively about Load Average.
. The “Tasks” column (second line): shows the total number of tasks/processes which is 329 in my case, the number of processes running which are 2, the number of sleeping processes which are 326, the number of stopped processes which is 1, and the number of zombie processes which is 0.
See below links to learn more about types of processes and how to manage processes in Linux.
Managing Processes In Linux Part 1
Managing Processes In Linux Part 2
Managing Processes In Linux Part 3
Managing Processes In Linux (Watch Video Tutorial)
RHCSA 8 Exam Practice Question related to Managing processes in Linux
. The “%Cpu (s)” column (third line): shows the state of the CPU in % since the last refresh.
- us signifies user: i.e, the amount of time spent in running processes that are not niced by users
- sy signifies system: i.e, the amount of time spent running processes that are kernel-related.
- ni signifies nice: i.e, the amount of time spent in running processes that are niced by users. click to know more about nice values
- id signifies idle: i.e, the amount of time spent in the kernel idle handler
- wa signifies I/O wait: i.e, the amount of time spent waiting for IO to be completed.
- hi shows the amount of time spent in maintaining hardware interrupts
- si show the time spent in maintaining software interrupts
- st shows the amount of time allocated to the virtual machine
. The “MiB Mem” column (fourth line): shows the total number of memory size in Megabyte, the free memory size, the used memory size, and the buffer/cache memory size.
The “MiB Swap” column (fifth line) shows the total number of swap memory size in megabyte, the free swap size, the used swap size, and the “available in memory” swap size.
The “PID” row shows the process IDs of the processes,
The “PR” row shows the process priority.
The “NI” row shows the nice value of the processes.
The “VIRT” row shows the virtual memory size used by the processes
The “RES” row shows the resident memory size, that is, the physical RAM size allocated to the processes.
The “SHR” row shows the shared memory size used by the processes
The “S” row shows the state of the processes using symbols.
The “%CPU” row shows the CPU usage of the processes.
The “%MEM” row shows the memory size used by the processes.
The “TIME+” row shows the time the processes have been running since boot.
The “COMMAND” row shows the command responsible for the processes or the name of the processes.
Using top utility also comes with great options.
To list the processes executed by a specific user, use the -u option.
For example, to list the processes that are used by the user, Victor, run the command,
[root@server1 ~]# top -u victor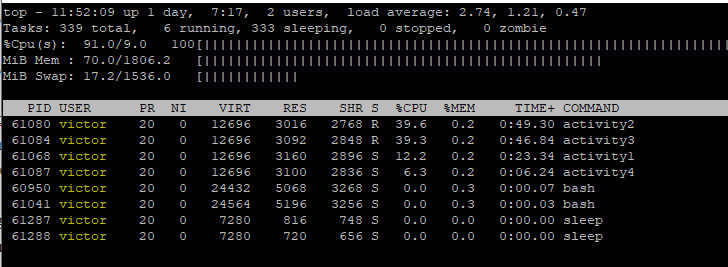
Suggested Article: Managing Services In Linux Effectively
Apart from the different options that come with using top from the command line, there are other great options you can use with top after executing the command “top”.
To get help or see the other options you can utilize, press the letter h
To sort out the processes by memory utilization, press the letter M.
To sort out the processes by CPU utilization, press the letter P
To sort out the processes by the running time, press the letter T
To see the absolute path of the processes, press the letter c
To sort out the processes in ascending order, starting from PID 1, press the letter R
To list by threads and see the number of threads, press the letter H
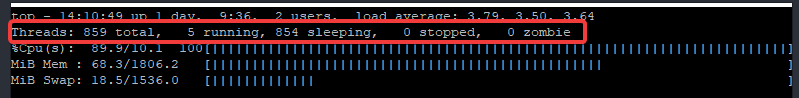
N:B: Threads and processes use the same data structure, hence they will have the same process elements. i.e, the process attributes will not change.
To revert listing by threads to process view again, press the letter H
To see the running processes highlighted in a different color from other processes, press the letter z
To kill a process using top, press the letter k (click here to see how)
To renice a process, press the letter r (click here to see how)
To see the forest view of the processes, press the letter V
To make the display bold, press the letter B, press B again to revert the changes
To filter processes with the top command, press the letter O.
To do this follow the steps below.
step 1: press the letter O, then input a value, for example, COMMAND as shown below, then input the command, for example, activity as shown below
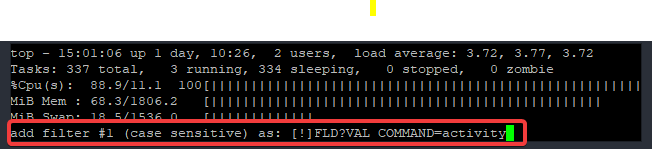
step 2: press enter, then you will see the display as shown below.
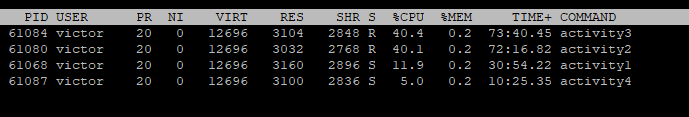
Step 3: press = to revert.
To change the default display or look of the top command, press the letter m and t again and again.
To save the new display or look of the top command after you might have changed it from the default, press the letter W. It will automatically save it as the default diaplay/look in a configuration file called (~/ .config/procps/toprc)
Suggested Tutorial: Managing Network In Linux Explained With Examples
vmstat, meaning virtual memory statistics. It is used to report virtual memory statistics such as processes, paging, kernel threads, and other important statistics related to CPU and beyond. It is a very good monitoring tool in Linux as well
To list the summary report of the system from boot time, use the command, “vmstat” without any option.
[root@DRDEV1 ~]# vmstat

procs -----------memory---------- ---swap-- -----io---- -system-- ------cpu-----
 r  b   swpd   free   buff  cache   si   so    bi    bo   in   cs us sy id wa st
 4  0 154624  75112    968 405212    0    6    45    14  925  174 58 32  9  0  0
[root@DRDEV1 ~]#
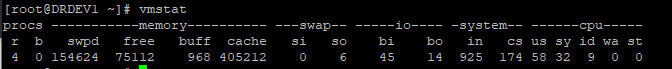
The important parameters related to processes are:
.The “r” column: shows the number of processes that are run-able
.The “b” column: shows the number of processes that are in uninterruptible sleep
.The “swapd“: column shows the virtual memory that has been used
.The “free” column: shows the amount of idle memory available
.The “buff” column: shows the amount of memory in the buffer that has been used
.The “cache” column: shows the cache memory that has been used.
.The “si” column: shows the memory swapped in from disk in KB
.The “so” column: shows the memory swapped out from disk in KB
.The “bi” and “bo” column is related to disks. However, it shows blocks received from and sent to block devices.
There are many options that can be used with the vmstat utility, some of the important options are as follows.
.To display the active and inactive memory, use the command,
[root@DRDEV1 ~]# vmstat -a
procs -----------memory---------- ---swap-- -----io---- -system-- ------cpu-----
 r  b   swpd   free  inact active   si   so    bi    bo   in   cs us sy id wa st
 3  0 154624 132328 509476 633520    0    5    41    12  933  171 57 34  9  0  0
.To display the a table of various event counters and memory statistics, use the command,
[root@DRDEV1 ~]# vmstat -s

      1849528 K total memory
      1324616 K used memory
       633552 K active memory
       509444 K inactive memory
       132296 K free memory
          968 K buffer memory
       391648 K swap cache
      1572860 K total swap
       154624 K used swap
      1418236 K free swap
      1814534 non-nice user cpu ticks
         4181 nice user cpu ticks
      1048258 system cpu ticks
       272498 idle cpu ticks
         1576 IO-wait cpu ticks
        36322 IRQ cpu ticks
         3855 softirq cpu ticks
            0 stolen cpu ticks
      1306243 pages paged in
       391957 pages paged out
         2729 pages swapped in
        41518 pages swapped out
     29690572 interrupts
      5416371 CPU context switches
   1603184845 boot time
        30071 forks
To display the number of forks since boot, use the command,
[root@DRDEV1 ~]#  vmstat -f
        30435 forks
Suggested Tutorial: How To Resize root Partition Online Without a Reboot
There are more options that are related to the “vmstat” utility. You can check the man page to see more and how they can be used.
From the word IO, this utility is basically used to display disk Input/output statistics. However, this utility can also be used to display some processes/memory/CPU information of the system.
iostat doesn’t come by default with RHEL 8/CentOS 8. The “sysstat” (system statistics) package has to be installed before one can use the “iostat” utility on RHEL/CentOS 8. iostat is one of the easy to use monitoring tools in Linux
To install the “sysstat” utility, use the command,
[root@DRDEV1 ~]# yum install sysstat

Updating Subscription Management repositories.
Red Hat Enterprise Linux 8 for x86_64 - AppStream (RPMs2.4 kB/s | 4.5 kB     00:01
Red Hat Enterprise Linux 8 for x86_64 - BaseOS (RPMs)              2.7 kB/s | 4.1 kB     00:01

..........................
To use the iostat utility, use the comamnd,
[root@DRDEV1 ~]# iostat

Linux 4.18.0-147.el8.x86_64 (DRDEV1)    10/20/2020      _x86_64_        (1 CPU)

avg-cpu:  %user   %nice %system %iowait  %steal   %idle
          56.34    0.13   35.55    0.05    0.00    7.94

Device             tps    kB_read/s    kB_wrtn/s    kB_read    kB_wrtn
sda               1.48        41.51        14.09    1443706     489960
sdb               0.00         0.10         0.00       3504          0
sdc               0.01         0.25         0.00       8781         28
scd0              0.00         0.03         0.00       1064          0
dm-0              1.23        39.85         7.27    1385848     252860
dm-1              1.79         0.46         6.76      16040     235016
To display the CPU statistics only with the iostat utility, use the command,
[root@DRDEV1 ~]# iostat -c

Linux 4.18.0-147.el8.x86_64 (DRDEV1)    10/20/2020      _x86_64_        (1 CPU)

avg-cpu:  %user   %nice %system %iowait  %steal   %idle
          56.16    0.13   35.89    0.04    0.00    7.78
where %user is the % of CPU utilization at the application/user level
%nice is the nice value in % of the CPU utilization at the user level
%system is the % of CPU utilization at the system/kernel level, and
%idle is idle time of the CPU in %
Suggested Tutorial: Five Ways To Effectively Boot To Single User Mode In Linux
There are more options that can be used with the iostat utility, check the man page to see their usages.
nmon is an acronym for “Nigel’s Monitor”. It is a very powerful system monitoring tool in Linux as well. A lot of administrators have confirmed nmon as one of the best monitoring tools in Linux
To use nmon, you have to install it.
Click here to see how to install nmon in RHEL/CentOS servers
After you are done with installing nmon, you have to launch nmon to use it.
To use nmon, use the command,
[root@DRDEV1 ~]# nmon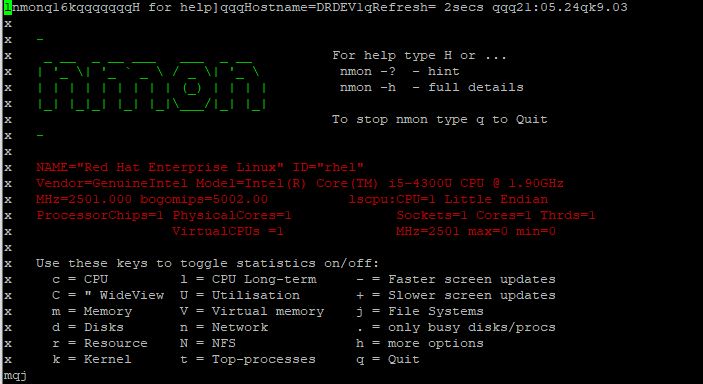
From the nmon interface, you can see the different keys to use to display different statistics.
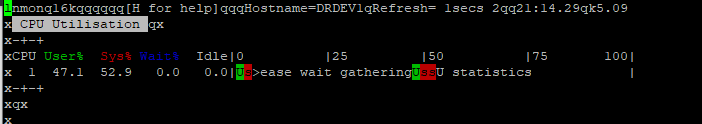
To display the CPU statistics/performance using nmon In Linux,
press the key, c
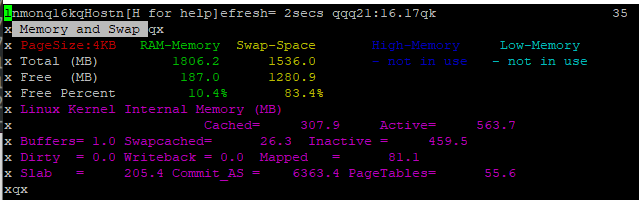
To display the Memory performance using nmon in Linux,
press the key, m
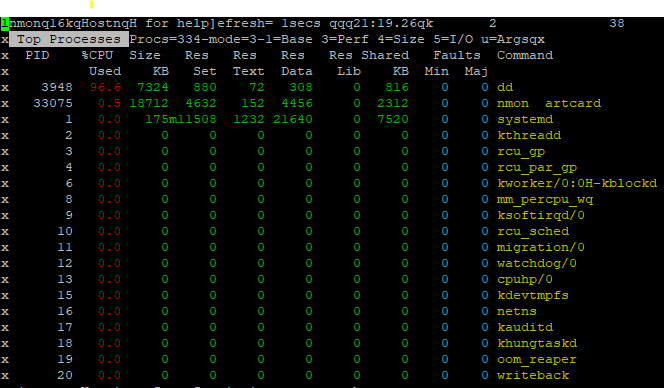
To display the top processes using nmon in Linux,
press the key, t
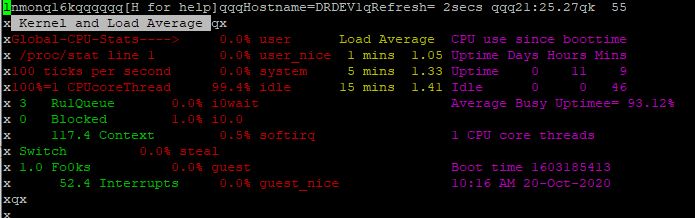
To display the kernel & Load average using nmon in Linux,
press the key, k
You can explore the other nmon options by pressing the keys you see when you first launch nmon.
More so, to know more about nmon options, you can explore the nmon man page. nmon is also one of the best monitoring tools in Linux
You can click the link below to watch the tutorial video on monitoring tools in Linux (monitoring tools in Linux)
Click the link below to see an exam practice question on monitoring tools in Linux (monitoring tools in Linux)
Your feedback is welcomed. If you love others, you will share with others
Leave a Reply