Last updated: October 2026
While monitoring a Kubernetes cluster, you may occasionally run:
[tekneed_Victor@vks01 ~]$ k top nodes

NAME                   CPU(cores)   CPU%   MEMORY(bytes)   MEMORY%
vks-prod-cp-01          278m         7%     4052Mi          64%
vks-prod-cp-02          269m         6%     5642Mi          90%
vks-prod-cp-03          199m         5%     3546Mi          57%
vks-prod-wn-001
vks-prod-wn-002
vks-prod-wn-003
............
At first glance, this looks like a serious problem.
One control-plane node appears to be using 90% of its memory, while the other two are using only 64% and 57%.
If the memory utilisation was previously around 40% and gradually increased to 90%, it is even easier to assume that there is a memory leak.
But is the node really running out of memory?
Not necessarily.
This article explains how to investigate this situation and why kubectl top can sometimes report high memory utilization even when the underlying Linux node has plenty of memory available.
What does kubectl top nodes actually show?
The kubectl top command gets resource usage information from Kubernetes metrics.
For example:
kubectl top nodesmight return:
NAME           CPU(cores)   CPU%   MEMORY(bytes)   MEMORY%
vks-prod-cp-01   207m        5%    3888Mi         64%
vks-prod-cp-02   251m        6%    5292Mi         90%
vks-prod-cp-03   179m        4%    3448Mi         57%
It is tempting to interpret this as:
The second node has physically consumed 90% of its RAM.
That interpretation can be incorrect sometimes.
The memory value reported by Kubernetes can include memory associated with the Linux filesystem cache.
This becomes particularly important on Kubernetes control-plane nodes because components such as etcd perform significant disk I/O and container logs are also written to disk.
Linux can keep recently accessed filesystem data in memory as cache.
That cache is useful because it makes subsequent disk operations faster.
Why does Linux use memory for cache?
Linux follows a simple principle:
Unused RAM is wasted RAM.
Instead of leaving RAM completely unused, Linux uses available memory for things such as:
- Filesystem cache
- Recently accessed files
- etcd database files
- Container-related files
- Logs
- Filesystem metadata
This memory can normally be reclaimed when an application actually needs it.
Therefore, seeing a large amount of memory classified as cache does not automatically mean that the node is running out of memory.
Now let’s troubleshoot a node that appears to have very high memory usage.
For this example, assume we have a VKS cluster with three control-plane nodes:
vks-prod-cp-01
vks-prod-cp-02
vks-prod-cp-03
The affected node is:
vks-prod-cp-021. Check the Node Memory
Start with:
kubectl top nodesExample:
[tekneed_Victor@vks01 ~]$ k top nodes

NAME              CPU(cores)   CPU%   MEMORY(bytes)   MEMORY%
vks-prod-cp-01    207m         5%     3888Mi          64%
vks-prod-cp-02    251m         6%     5292Mi          90%
vks-prod-cp-03    179m         4%     3448Mi          57%
At this point, it would be easy to conclude that:
vks-prod-cp-02has a memory problem.
But don’t stop here.
2. Check the Pods Running on the Node
Next, find out which pods are running on the affected node:
To see the pods running on a particular node, use the command below.
NODE=<node-name>kubectl get pods -A --field-selector spec.nodeName=$NODE
For example,
[tekneed_Victor@vks01 ~]$ NODE=vks-prod-cp-02
[tekneed_Victor@vks01 ~]$
[tekneed_Victor@vks01 ~]$ kubectl get pods -A --field-selector spec.nodeName=$NODE
NAMESPACE NAME READY STATUS RESTARTS AGE
kube-system antrea-agent-xxxx 2/2 Running 0 26d
kube-system elastic-agent-xxxx 1/1 Running 0 9h
kube-system etcd-vks-prod-cp-02 1/1 Running 0 26d
kube-system kube-apiserver-xxx 1/1 Running 0 26d
............To see the memory and CPU consumption of all the pods running on a node, use the command below:
NODE=<node-name>echo -e "NAMESPACE\tPOD\tCPU\tMEMORY"
kubectl get pods -A --field-selector spec.nodeName=$NODE --no-headers |
while read ns pod rest; do
kubectl top pod -n "$ns" "$pod" --no-headers | \
awk -v ns="$ns" '{print ns"\t"$1"\t"$2"\t"$3}'
done | sort -k4 -hr | nlFor example,
[tekneed_Victor@vks01 ~]$ NODE=vks-prod-cp-02
[tekneed_Victor@vks01 ~]$
[tekneed_Victor@vks01 ~]$ echo -e "NAMESPACE\tPOD\tCPU\tMEMORY"
kubectl get pods -A --field-selector spec.nodeName=$NODE --no-headers |
while read ns pod rest; do
kubectl top pod -n "$ns" "$pod" --no-headers | \
awk -v ns="$ns" '{print ns"\t"$1"\t"$2"\t"$3}'
done | sort -k4 -hr | nl
NAMESPACE POD CPU MEMORY
kube-system kube-apiserver-vks-prod-cp-02 115m 1181Mi
kube-system elastic-agent-xxxxx 11m 593Mi
kube-system kube-controller-manager-xxxxx 34m 244Mi
kube-system etcd-xxxxx 72m 189Mi
kube-system antrea-agent-xxxxx 13m 150Mi
kube-system kube-scheduler-xxxxx 6m 134Mi
tkg-system kapp-controller-xxxxx 3m 119Mi
observability-system wavefront-node-collector-xxxxx 4m 85Mi
NB: The output may not be well arranged in your environment but you will sure get your result. When you copy and paste, you may also see the > signs as shown below.
 kubectl get pods -A --field-selector spec.nodeName=$NODE --no-headers |
> while read ns pod rest; do
>     kubectl top pod -n "$ns" "$pod" --no-headers | \
>     awk -v ns="$ns" '{print ns"\t"$1"\t"$2"\t"$3}'
> done | sort -k4 -hr | nl
Adding the pod memory together might give approximately:
2.7 GiBBut kubectl top node might report:
5.3 GiBThis is where the investigation becomes interesting.
3. Why Doesn’t Pod Memory Equal Node Memory?
This is one of the most important concepts to understand.
You might expect:
Total node memory
=
Memory used by all pods
But this is not necessarily true.
There is memory being used at the node level that isn’t represented as normal pod memory.
This can include:
- Linux filesystem cache
- Kernel memory
- kubelet
- container runtime
- Operating system processes
- Filesystem metadata
- Network-related memory
- Other system-level allocations
A simplified representation looks like this:
                 NODE MEMORY
                      |
          +-----------+-----------+
          |                       |
      Pod Memory              Node Memory
          |                       |
     Applications            Linux kernel
     API server              Filesystem cache
     etcd                    kubelet
     Antrea                  container runtime
     Agents                  system processes
                             etc.
Therefore, comparing:
kubectl top poddirectly against:
kubectl top nodedoes not always give you a one-to-one comparison.
4. Check the Node Conditions
Before assuming that the node is running out of memory, check its conditions:
[tekneed_Victor@vks01 ~]$ kubectl describe node vks-prod-cp-02 | grep -A10 "Conditions:"You may see:
Conditions:
  Type             Status
  ----             ------
  MemoryPressure   False
  DiskPressure     False
  PIDPressure      False
  Ready            True
The important value here is:
MemoryPressure FalseThis means kubelet does not currently consider the node to be under memory pressure.
You may also see:
Reason: KubeletHasSufficientMemory
Message: kubelet has sufficient memory available
This is an important distinction.
A node can show a high percentage in:
kubectl top nodeswhile still having sufficient memory available from the operating system’s perspective.
5. Check Capacity and Allocatable Memory
Another useful command is:
[tekneed_Victor@vks01 ~]$ kubectl describe node vks-prod-cp-02Look for:
Capacity:
  memory: ...

Allocatable:
  memory: ...
For example:
Capacity:
  memory: 7.8Gi

Allocatable:
  memory: 6193900Ki
The node may physically have around:
7.8 GiBwhile Kubernetes has approximately:
5.9 GiBavailable as allocatable memory.
This difference is expected because Kubernetes reserves some resources for the operating system and system components.
6. The Linux free -h Command Is Very Important
If you have OS-level access to the node, run:
[tekneed_Victor@vks01 ~]$ free -hFor example:
              total        used        free      shared  buff/cache   available
Mem:           7.8Gi       3.4Gi       279Mi       7.4Mi       4.4Gi       4.3Gi
At first, someone might look at:
used = 3.4Gi
free = 279Mi
and become concerned.
But the most important value here is:
available = 4.3GiThe system has approximately 4.3 GiB of memory available for applications.
The:
4.4Gishown under:
buff/cacheis largely filesystem cache.
This is memory Linux can reclaim when applications need it.
7. Understanding the Filesystem Cache
This is the part that caused the apparently high Kubernetes memory utilization.
On a Kubernetes control-plane node, files associated with components such as etcd and container logs can be accessed frequently.
Linux may keep these files in memory.
For example:
etcd database files
        |
        v
Linux reads files
        |
        v
Filesystem cache
        |
        v
RAM
This improves performance because Linux doesn’t always have to read the data from disk again.
However, Kubernetes’ memory metrics can account for some of this cached memory.
This can make:
kubectl top nodeappear much higher than what you might expect from simply adding the memory consumed by the pods.
8. Why kubectl top Can Show 90%
Kubernetes uses cAdvisor/container memory metrics, including the container_memory_working_set_bytes metric. The working-set calculation can include memory associated with filesystem cache, which can cause kubectl top to report higher memory utilization than what you might expect from application memory alone.
The working set can include memory associated with active filesystem cache.
Therefore, you can have a situation like this:
Physical VM memory
------------------
7.8 GiB


Linux
------------------
Used:          3.4 GiB
Cache:         4.4 GiB
Available:     4.3 GiB


Kubernetes
------------------
Allocatable:   ~5.9 GiB
Reported use:  ~5.3 GiB
Reported:      ~90%
This may look contradictory.
It isn’t.
They are simply measuring memory differently.
9. Is 90% Memory Usage a Memory Leak?
Not necessarily.
This is where you need to be careful.
Suppose you observe:
40%
50%
65%
75%
87%
90%
It is perfectly reasonable to suspect a memory leak.
However, before concluding that there is a leak, determine what type of memory is increasing.
If the increase is primarily filesystem cache and Linux still reports a healthy amount of:
availablememory, then the increasing kubectl top percentage does not necessarily indicate a leak.
On the other hand, a genuine memory leak is more concerning when you see:
Available memory continually decreasingalong with:
MemoryPressure=Trueor:
OOMKilled
Evicted
NodeNotReady
or other memory-related failures.
10. Compare All Control-Plane Nodes
This is another very useful troubleshooting technique.
Don’t investigate the affected node in isolation.
Compare all three control-plane nodes:
kubectl top nodesFor example:
NAME              MEMORY%
vks-prod-cp-01       64%
vks-prod-cp-02       90%
vks-prod-cp-03       57%
Then compare their pods:
kubectl top pod -AIf all three nodes have roughly the same system components and similar pod memory consumption, but one node reports significantly higher memory, that tells you that you need to investigate node-level memory accounting, not simply look for a pod consuming excessive memory.
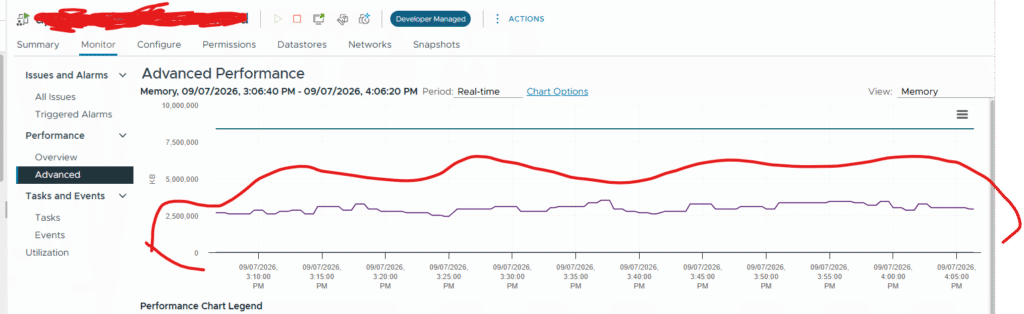
12. Check the Hypervisor When Running Kubernetes on VMs
If your Kubernetes nodes are virtual machines running on VMware vSphere, don’t rely only on Kubernetes metrics.
Check the VM from the vSphere side as well.
For example, if the Kubernetes node has:
8 GB RAMand the vSphere performance chart shows actual VM memory consumption around:
3-4 GBwhile Kubernetes reports:
~90%that is an important clue.
It indicates that the Kubernetes percentage needs to be interpreted in the context of the underlying operating system and hypervisor metrics.
In a VKS environment, looking at:
Kubernetes
+
Linux
+
vSphere
gives you a much better picture than looking at kubectl top alone.
Common Mistake
One of the most common mistakes when troubleshooting Kubernetes memory is saying:
“
kubectl topsays 90%, therefore the node has only 10% memory remaining.”
That is too simplistic.
You need to understand what Kubernetes is measuring and compare it with the actual memory state reported by the operating system.
For example:
kubectl top node
        ↓
90%
does not automatically mean:
90% of physical RAM is unreclaimableThe Linux system could still have significant:
availablememory because a large portion of the reported usage is cache that can be reclaimed.
NOTE: The command below can also be used to get all the pods running on a node
[tekneed_Victor@vks01 ~]$ k top pod -A --sort-by=memory | grep -F -f <(kubectl get pods -A --field-selector spec.nodeName=vks-prod-cp-02 -o custom-columns=NAME:.metadata.name --no-headers)

kube-system                     kube-apiserver-vks-prod-cp-02                       104m         1171Mi
kube-system                     elastic-agent-9hxjf                                               9m           568Mi
kube-system                     kube-controller-manager-vks-prod-cp-02-t5f9d              31m          264Mi
kube-system                     etcd-vks-prod-cp-02                                 72m          169Mi
kube-system                     antrea-agent-2hzp9                                                14m          151Mi
kube-system                     kube-scheduler-vks-prod-cp-02                       9m           145Mi
tkg-system                      kapp-controller-5f576489cb-fse343                                  4m           124Mi
observability-system            wavefront-node-collector-frw32                                    2m           93Mi
kube-system                     kube-proxy-42ds3s                                                  1m           39Mi
vmware-system-cloud-provider    guest-cluster-cloud-provider-6d5ccbf7b-mdwgd                      2m           28Mi
vmware-system-csi               vsphere-csi-node-431df                                            1m           22Mi
tanzu-system-logging            fluent-bit-4241dq                                                  13m          20Mi
vmware-system-auth              guest-cluster-auth-svc-45sa3                                     1m           7Mi
Leave a Reply